2008 UK local government election
2008 South Lakeland District Council election |
All 51 seats to South Lakeland District Council
26 seats needed for a majority |
|---|
| | First party | Second party | Third party | | | | | | | Party | Liberal Democrats | Conservative | Labour | | Seats won | 36 | 14 | 1 | | Popular vote | 24,355 | 16,100 | 1,387 | | Percentage | 57.9% | 38.3% | 3.3% | |
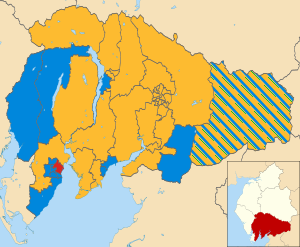 Map showing the results of the 2008 South Lakeland District Council elections by ward. Liberal Democrats in yellow, Conservatives in blue, Labour in red. |
Council control before election
Liberal Democrats
| Council control after election
Liberal Democrats
| |
The 2008 South Lakeland District Council election took place on 1 May 2008 to elect members of South Lakeland District Council in Cumbria, England. The whole council was up for election with boundary changes since the last election in 2007 reducing the number of seats by 1.[1] The Liberal Democrats stayed in overall control of the council.[2]
Background
Since the last election in 2007 boundary changes had taken place reducing the number of seats from 52 to 51.[3] Among the changes made was the combining of the Sedbergh and Kirkby Lonsdale wards.[3]
Before the election the Liberal Democrats ran the council with 31 seats, compared to 16 for the Conservatives, 2 for Labour, 1 Green Party and 1 independent.[4] Among the sitting councillors to stand down at the election was the only independent David Foot.[3]
Election result
The results saw the Liberal Democrats increase their majority on the council finishing the election up on 36 councillors.[3] This came at the expense of the Conservatives who dropped to 14 seats and Labour who lost 1 of their 2 councillors.[3] Meanwhile, the Green Party also lost their only seat in Kendal Far Cross.[5]
| Party | Previous council | New council | +/- |
| | Liberal Democrats | 33 | 36 |  3 3 |
| | Conservatives | 17 | 14 |  3 3 |
| | Labour | 2 | 1 |  |
| | Green | 1 | 0 | |
| | Independent | 1 | 0 | |
| Total | 51 | 51 | |
| Working majority | 12 | 21 | |
South Lakeland Local Election Result 2008[1][6] | Party | Seats | Gains | Losses | Net gain/loss | Seats % | Votes % | Votes | +/− |
| | Liberal Democrats | 36 | | | +4 | 70.6 | 57.4 | 30,627 | +0.4% |
| | Conservative | 14 | | | -2 | 27.5 | 39.6 | 21,111 | -1.2% |
| | Labour | 1 | | | -1 | 2.0 | 2.6 | 1,387 | +2.3% |
| | Green | 0 | | | -1 | 0 | 0.4 | 228 | -0.2% |
| | Independent | 0 | | | -1 | 0 | 0 | 0 | 0 |
Ward results
Ambleside & Grasmere (2)[6] | Party | Candidate | Votes | % | ±% |
| | Liberal Democrats | Vivienne Rees* | 1,140 | 66.9 | |
| | Liberal Democrats | David Vatcher* | 1,113 | 65.3 | |
| | Conservative | Brian Barton | 542 | 31.8 | |
| | Conservative | Tim Brown | 518 | 30.4 | |
| Majority | 571 | 33.5 | |
| Turnout | 1,704 | 42.6 | |
Arnside & Beetham (2)[6] | Party | Candidate | Votes | % | ±% |
| | Liberal Democrats | Pru Jupe* | 1,337 | 60.2 | |
| | Liberal Democrats | Ian Stewart* | 1,292 | 58.2 | |
| | Conservative | Peter Fisher | 845 | 38.1 | |
| | Conservative | Sue Blonsky | 836 | 37.7 | |
| Majority | 447 | 20.1 | |
| Turnout | 2,220 | 62.7 | |
Broughton[6] | Party | Candidate | Votes | % | ±% |
| | Conservative | Joss Curwen* | 667 | 63.6 | |
| | Liberal Democrats | Barry Rabone | 382 | 36.4 | |
| Majority | 285 | 27.2 | |
| Turnout | 1,049 | 56.9 | |
Burneside[6] | Party | Candidate | Votes | % | ±% |
| | Liberal Democrats | Frank Hodson* | 578 | 74.7 | |
| | Conservative | Eric Wright | 196 | 25.3 | |
| Majority | 382 | 49.4 | |
| Turnout | 774 | 48.4 | |
Burton & Holme (2)[6] | Party | Candidate | Votes | % | ±% |
| | Conservative | Roger Bingham* | 1,132 | 67.2 | |
| | Conservative | Brian Cooper | 916 | 54.4 | |
| | Liberal Democrats | Geoff Johnston | 597 | 35.4 | |
| | Liberal Democrats | Scott Chandler | 524 | 31.1 | |
| Majority | 319 | 19.0 | |
| Turnout | 1,685 | 57.1 | |
Cartmel & Grange West[6] | Party | Candidate | Votes | % | ±% |
| | Liberal Democrats | Mary Wilson | 617 | 65.4 | |
| | Conservative | Steve Chambers | 326 | 34.6 | |
| Majority | 291 | 30.9 | |
| Turnout | 943 | 61.2 | |
Coniston & Crake Valley[6] | Party | Candidate | Votes | % | ±% |
| | Conservative | Anne Hall* | 518 | 64.0 | |
| | Liberal Democrats | John Hemingway | 291 | 36.0 | |
| Majority | 227 | 28.1 | |
| Turnout | 809 | 59.3 | |
Crooklands[6] | Party | Candidate | Votes | % | ±% |
| | Liberal Democrats | Sheila Eccles* | 803 | 70.4 | |
| | Conservative | Rob Cocker* | 338 | 29.6 | |
| Majority | 465 | 40.8 | |
| Turnout | 1,141 | 64.8 | |
- Rob Cocker was originally elected as a Liberal Democrat councillor.
Grange North[6] | Party | Candidate | Votes | % | ±% |
| | Conservative | Bill Wearing* | 580 | 62.8 | |
| | Liberal Democrats | Russell Boardman | 344 | 37.2 | |
| Majority | 236 | 25.5 | |
| Turnout | 924 | 49.4 | |
Grange South[6] | Party | Candidate | Votes | % | ±% |
| | Conservative | Tom Harvey* | 501 | 50.5 | |
| | Liberal Democrats | Anluise Hamilton-Bruce | 492 | 49.5 | |
| Majority | 9 | 0.9 | |
| Turnout | 993 | 62.6 | |
Hawkshead[6] | Party | Candidate | Votes | % | ±% |
| | Liberal Democrats | Colin Davies | 486 | 53.5 | |
| | Conservative | Claire Salisbury | 422 | 46.5 | |
| Majority | 64 | 7.0 | |
| Turnout | 908 | 60.4 | |
Holker[6] | Party | Candidate | Votes | % | ±% |
| | Liberal Democrats | Maureen Nicholson | 471 | 56.1 | |
| | Conservative | Ruth Airey | 368 | 43.9 | |
| Majority | 103 | 12.3 | |
| Turnout | 839 | 52.8 | |
Kendal Castle[6] | Party | Candidate | Votes | % | ±% |
| | Liberal Democrats | Sonia Lawson* | 617 | 69.3 | |
| | Conservative | James Alexander | 273 | 30.7 | |
| Majority | 344 | 38.7 | |
| Turnout | 890 | 56.7 | |
Kendal Far Cross[6] | Party | Candidate | Votes | % | ±% |
| | Liberal Democrats | Clive Graham* | 478 | 65.1 | |
| | Conservative | Lyndsay Slater | 147 | 20.0 | |
| | Green | Enda Farrell* | 109 | 14.9 | |
| Majority | 331 | 45.1 | |
| Turnout | 734 | 44.6 | |
- Enda Farrell was originally elected as a Liberal Democrat councillor.
Kendal Fell[6] | Party | Candidate | Votes | % | ±% |
| | Liberal Democrats | Paul Little* | 508 | 70.4 | |
| | Conservative | Diana Crewdson | 133 | 18.4 | |
| | Labour | Lois Sparling | 81 | 11.2 | |
| Majority | 375 | 51.9 | |
| Turnout | 722 | 44.0 | |
Kendal Heron Hill[6] | Party | Candidate | Votes | % | ±% |
| | Liberal Democrats | Andy Shine* | 640 | 77.6 | |
| | Conservative | Ian Tomlinson | 185 | 22.4 | |
| Majority | 455 | 55.2 | |
| Turnout | 825 | 54.2 | |
Kendal Highgate[6] | Party | Candidate | Votes | % | ±% |
| | Liberal Democrats | Chris Hogg | 537 | 82.9 | |
| | Conservative | Deborah Huck | 111 | 17.1 | |
| Majority | 426 | 65.7 | |
| Turnout | 648 | 39.7 | |
Kendal Kirkland[6] | Party | Candidate | Votes | % | ±% |
| | Liberal Democrats | Julie Dawson | 412 | 68.4 | |
| | Labour | Robert Rothwell | 112 | 18.6 | |
| | Conservative | Elizabeth Cartmell | 78 | 13.0 | |
| Majority | 300 | 49.8 | |
| Turnout | 602 | 36.2 | |
Kendal Mintsfeet[6] | Party | Candidate | Votes | % | ±% |
| | Liberal Democrats | Jonathan Brook* | 587 | 82.0 | |
| | Conservative | Margaret Williams | 129 | 18.0 | |
| Majority | 458 | 64.0 | |
| Turnout | 716 | 45.3 | |
Kendal Nether[6] | Party | Candidate | Votes | % | ±% |
| | Liberal Democrats | Clare Feeney-Johnson* | 702 | 85.2 | |
| | Conservative | William Parker | 122 | 14.8 | |
| Majority | 580 | 70.4 | |
| Turnout | 824 | 49.2 | |
Kendal Oxenholme & Natland[6] | Party | Candidate | Votes | % | ±% |
| | Liberal Democrats | Brenda Gray* | 596 | 68.2 | |
| | Conservative | Nigel Byrom | 278 | 31.8 | |
| Majority | 318 | 36.4 | |
| Turnout | 874 | 54.1 | |
Kendal Parks[6] | Party | Candidate | Votes | % | ±% |
| | Liberal Democrats | Brendon Jameson* | 568 | 79.4 | |
| | Conservative | Peter Birchall | 147 | 20.6 | |
| Majority | 421 | 58.9 | |
| Turnout | 715 | 41.8 | |
Kendal Romney[6] | Party | Candidate | Votes | % | ±% |
| | Liberal Democrats | Graham Vincent* | 615 | 80.2 | |
| | Conservative | Pam Flitcroft | 152 | 19.8 | |
| Majority | 463 | 60.4 | |
| Turnout | 767 | 45.4 | |
Kendal Stonecross[6] | Party | Candidate | Votes | % | ±% |
| | Liberal Democrats | Sylvia Emmott* | 743 | 82.9 | |
| | Conservative | Jack Tomlinson | 153 | 17.1 | |
| Majority | 590 | 65.8 | |
| Turnout | 896 | 55.2 | |
Kendal Strickland[6] | Party | Candidate | Votes | % | ±% |
| | Liberal Democrats | Stephen Coleman* | 611 | 83.9 | |
| | Conservative | Kate Williams | 117 | 16.1 | |
| Majority | 494 | 67.9 | |
| Turnout | 728 | 48.8 | |
Kendal Underley[6] | Party | Candidate | Votes | % | ±% |
| | Liberal Democrats | Gwen Murfin* | 541 | 69.1 | |
| | Labour | Paul Braithwaite | 125 | 16.0 | |
| | Conservative | Alan Price | 117 | 14.9 | |
| Majority | 416 | 53.1 | |
| Turnout | 783 | 47.2 | |
Levens[6] | Party | Candidate | Votes | % | ±% |
| | Liberal Democrats | Brenda Woof* | 737 | 64.1 | |
| | Conservative | Alisa Hulme | 412 | 35.9 | |
| Majority | 325 | 28.3 | |
| Turnout | 1,149 | 67.2 | |
Low Furness[6] | Party | Candidate | Votes | % | ±% |
| | Conservative | James Airey | 415 | 51.8 | |
| | Liberal Democrats | Ray Beecham | 343 | 42.8 | |
| | Green | Jo-Anna Duncalf | 43 | 5.4 | |
| Majority | 72 | 9.0 | |
| Turnout | 801 | 54.4 | |
Lyth Valley[6] | Party | Candidate | Votes | % | ±% |
| | Liberal Democrats | Rosie Ballantyne-Smith | 585 | 55.6 | |
| | Conservative | Robin Brown* | 467 | 44.4 | |
| Majority | 118 | 11.2 | |
| Turnout | 1,052 | 57.6 | |
Mid Furness (2)[6] | Party | Candidate | Votes | % | ±% |
| | Liberal Democrats | Jackie Cooper | 969 | 62.7 | |
| | Liberal Democrats | Jane Carson | 925 | 59.9 | |
| | Conservative | Wendy Barry | 539 | 34.9 | |
| | Conservative | Anne Fisher | 404 | 26.1 | |
| | Labour | Bharath Rajan | 88 | 5.7 | |
| Majority | 386 | 25.0 | |
| Turnout | 1,545 | 48.6 | |
Milnthorpe[6] | Party | Candidate | Votes | % | ±% |
| | Liberal Democrats | Alan Baverstock | 681 | 75.4 | |
| | Conservative | Mike Coyle | 222 | 24.6 | |
| Majority | 459 | 50.8 | |
| Turnout | 903 | 54.1 | |
Sedbergh & Kirkby Lonsdale (3)[6] | Party | Candidate | Votes | % | ±% |
| | Conservative | Kevin Lancaster* | 1,432 | 52.2 | |
| | Liberal Democrats | Peter Woof | 1,274 | 46.5 | |
| | Liberal Democrats | Ian McPherson | 1,245 | 45.4 | |
| | Conservative | Rodger Read* | 1,210 | 44.1 | |
| | Liberal Democrats | Fenner Pearson | 1,183 | 43.1 | |
| | Conservative | Anne Fenwick | 1,127 | 41.1 | |
| Majority | 35 | 1.3 | |
| Turnout | 2,742 | 56.6 | |
Staveley-in-Cartmel[6] | Party | Candidate | Votes | % | ±% |
| | Liberal Democrats | Clive Leal | 462 | 52.6 | |
| | Conservative | Ted Walsh | 416 | 47.4 | |
| Majority | 46 | 5.2 | |
| Turnout | 878 | 55.7 | |
Staveley-in-Westmorland[6] | Party | Candidate | Votes | % | ±% |
| | Liberal Democrats | Stan Collins* | 724 | 80.1 | |
| | Conservative | Angela Wright | 180 | 19.9 | |
| Majority | 544 | 60.2 | |
| Turnout | 904 | 53.4 | |
Ulverston Central[6] | Party | Candidate | Votes | % | ±% |
| | Conservative | Norman Bishop-Rowe* | 292 | 57.4 | |
| | Labour | Roy Gill | 159 | 31.2 | |
| | Liberal Democrats | John Humberstone | 58 | 11.4 | |
| Majority | 133 | 26.1 | |
| Turnout | 509 | 33.0 | |
Ulverston East[6] | Party | Candidate | Votes | % | ±% |
| | Labour | John Wilson | 208 | 44.2 | |
| | Conservative | Peter Hornby | 189 | 40.1 | |
| | Liberal Democrats | Ronald Edmondson | 74 | 15.7 | |
| Majority | 19 | 4.0 | |
| Turnout | 471 | 29.4 | |
Ulverston North[6] | Party | Candidate | Votes | % | ±% |
| | Conservative | Colin Hodgson* | 388 | 55.3 | |
| | Labour | Joan Casson | 166 | 23.6 | |
| | Green | Simon Filmore | 76 | 10.8 | |
| | Liberal Democrats | Charley Darbishire | 72 | 10.3 | |
| Majority | 222 | 31.6 | |
| Turnout | 702 | 46.8 | |
Ulverston South[6] | Party | Candidate | Votes | % | ±% |
| | Conservative | Brian Wilkinson* | 398 | 64.9 | |
| | Labour | Judith Pickthall | 133 | 21.7 | |
| | Liberal Democrats | Celia Birchall | 82 | 13.4 | |
| Majority | 265 | 43.2 | |
| Turnout | 613 | 40.9 | |
Ulverston Town[6] | Party | Candidate | Votes | % | ±% |
| | Conservative | Jamie Samson | 208 | 43.5 | |
| | Labour | Colin Williams | 204 | 42.7 | |
| | Liberal Democrats | Barbara Rabone | 66 | 13.8 | |
| Majority | 4 | 0.8 | |
| Turnout | 478 | 32.9 | |
Ulverston West[6] | Party | Candidate | Votes | % | ±% |
| | Conservative | Janette Jenkinson* | 448 | 70.0 | |
| | Labour | Colin Pickthall | 111 | 17.3 | |
| | Liberal Democrats | Loraine Birchall | 81 | 12.7 | |
| Majority | 337 | 52.7 | |
| Turnout | 640 | 41.2 | |
Whinfell[6] | Party | Candidate | Votes | % | ±% |
| | Liberal Democrats | Peter Thornton* | 488 | 62.2 | |
| | Conservative | Mel Mackie | 297 | 37.8 | |
| Majority | 191 | 24.3 | |
| Turnout | 785 | 52.3 | |
Windermere Applethwaite & Troutbeck[6] | Party | Candidate | Votes | % | ±% |
| | Liberal Democrats | Jo Stephenson | 518 | 54.0 | |
| | Conservative | Michael Nicholson | 442 | 46.0 | |
| Majority | 76 | 7.9 | |
| Turnout | 960 | 56.1 | |
Windermere Bowness North[6] | Party | Candidate | Votes | % | ±% |
| | Liberal Democrats | Hilary Stephenson* | 654 | 74.2 | |
| | Conservative | Stephen Hall | 227 | 25.8 | |
| Majority | 427 | 48.5 | |
| Turnout | 881 | 51.9 | |
Windermere Bowness South[6] | Party | Candidate | Votes | % | ±% |
| | Conservative | David Williams* | 433 | 65.2 | |
| | Liberal Democrats | Dyan Jones | 231 | 34.8 | |
| Majority | 202 | 30.4 | |
| Turnout | 664 | 41.9 | |
Windermere Town[6] | Party | Candidate | Votes | % | ±% |
| | Liberal Democrats | Kath Atkinson* | 553 | 82.4 | |
| | Conservative | Enid Robinson | 118 | 17.6 | |
| Majority | 435 | 64.8 | |
| Turnout | 671 | 41.1 | |
References
- ^ a b "South Lakeland". BBC News Online. Retrieved 11 August 2011.
- ^ "Local elections 2008" (PDF). House of Commons Library. 12 June 2008. Retrieved 13 August 2011.
- ^ a b c d e "South Lakes election results". Lancaster Guardian. 7 May 2008. Retrieved 13 August 2011.
- ^ Barber, Caroline (11 April 2008). "All seats up for grabs in council election". The Westmorland Gazette. Retrieved 13 August 2011.
- ^ Orr, Daniel (2 May 2008). "Liberal Democrats dominate elections". The Westmorland Gazette. Retrieved 13 August 2011.
- ^ a b c d e f g h i j k l m n o p q r s t u v w x y z aa ab ac ad ae af ag ah ai aj ak al am an ao ap aq ar as at "South Lakeland District Council elections, 1 May 2008" (PDF). South Lakeland District Council. Archived from the original (PDF) on 27 September 2011. Retrieved 11 August 2011.

 3
3  3
3 


