1967 UK local election
1967 Liverpool City Council election
|
|
| |
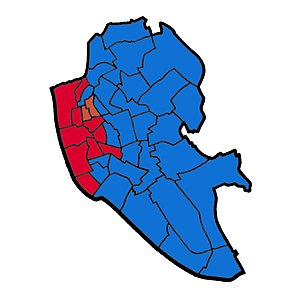 Map of Liverpool showing wards won (first placed party) [1] |
Elections to Liverpool City Council were held on 11 May 1967.
After the election, the composition of the council was:
| Party | Councillors | ± | Aldermen | Total |
| | Conservative | 67 | +17 | 17 | 84 |
| | Labour | 46 | -16 | 22 | 68 |
| | Liberal | 1 | 0 | 1 | 2 |
| | Protestant | 6 | +1 | 0 | 6 |
Election result
Liverpool Local Election Result 1967 | Party | Seats | Gains | Losses | Net gain/loss | Seats % | Votes % | Votes | +/− |
| | Conservative | 28 | | | | 68% | 59% | 91,809 | |
| | Labour | 11 | | | | 27% | 36% | 55,888 | |
| | Liberal | 0 | 0 | 0 | 0 | 0% | 4.2% | 6,493 | |
| | Protestant | 2 | 0 | 0 | 2 | 5% | 1.5% | 2,352 | |
| | Communist | 0 | 0 | 0 | 0 | 0% | 1% | 1,581 | |
Ward results
* - Councillor seeking re-election
(PARTY) - Party of former Councillor
The Councillors seeking re-election at this election were elected in 1964 for a three-year term, therefore comparisons are made with the 1964 election results.
Abercromby
Abercromby | Party | Candidate | Votes | % | ±% |
| | Labour | John E. McPherson * | 695 | 48% | -15% |
| | Conservative | Herbert C. Norcott | 603 | 41% | +11% |
| | Communist | A. McClelland | 159 | 11% | +3% |
| Majority | 92 | | |
| Registered electors | 7,276 | | |
| Turnout | 1,457 | 20% | -3% |
| | Labour hold | Swing | | |
Aigburth
Aigburth | Party | Candidate | Votes | % | ±% |
| | Conservative | John E. R. Fischer * | 5,030 | 79% | +11% |
| | Liberal | Alan G. Wilson | 884 | 14% | -7% |
| | Labour | Edwin C. Pimlett | 459 | 7% | -4% |
| Majority | 4,146 | | |
| Registered electors | 13,430 | | |
| Turnout | 6,373 | 47% | +8% |
| | Conservative hold | Swing | | |
Allerton
Allerton | Party | Candidate | Votes | % | ±% |
| | Conservative | Stanley B. Caulfield * | 3,392 | 80% | +15% |
| | Labour | Rodney Ludvigsen | 434 | 10% | -6% |
| | Liberal | Mrs. Margaret S. Springbett | 405 | 10% | -9% |
| Majority | 2,958 | | |
| Registered electors | 9,887 | | |
| Turnout | 4,231 | 43% | +3% |
| | Conservative hold | Swing | | |
Anfield
Anfield | Party | Candidate | Votes | % | ±% |
| | Conservative | James A. Porter M.B.E. * | 3,407 | 72% | +21% |
| | Labour | Sydesy W. Jones | 1,352 | 28% | -14% |
| Majority | 2,055 | | |
| Registered electors | 13,033 | | |
| Turnout | 4,759 | 37% | -2% |
| | Conservative hold | Swing | | |
Arundel
Arundel | Party | Candidate | Votes | % | ±% |
| | Conservative | John E. Kendrick | 2,840 | 69% | +21% |
| | Labour | Joseph Cloherty | 1,137 | 28% | -7% |
| | Communist | Jack Kay | 134 | 3% | +1% |
| Majority | 1,703 | | |
| Registered electors | 12,243 | | |
| Turnout | 4,111 | 34% | -3% |
| | Conservative hold | Swing | | |
Breckfield
Breckfield | Party | Candidate | Votes | % | ±% |
| | Conservative | Kenneth B. Jacques | 1,929 | 57% | +18% |
| | Labour | Andrew Williams * | 1,430 | 43% | -18% |
| Majority | 499 | | |
| Registered electors | 9,897 | | |
| Turnout | 3,359 | 34% | +4% |
| | Conservative gain from Labour | Swing | | |
Broadgreen
Broadgreen | Party | Candidate | Votes | % | ±% |
| | Conservative | Mrs. Lennie Sanders * | 2,693 | 70% | +17% |
| | Labour | John W. Hubble | 744 | 19% | -12% |
| | Resident | Ernest Bide | 436 | 11% | |
| Majority | 1,948 | | |
| Registered electors | 11,003 | | |
| Turnout | 3,872 | 35% | 0% |
| | Conservative hold | Swing | | |
Central
Central | Party | Candidate | Votes | % | ±% |
| | Labour | James E. Walker (PARTY) | 1,299 | 53% | -14% |
| | Conservative | John R. P. Dennis | 1,151 | 47% | +14% |
| Majority | 148 | | |
| Registered electors | 7,186 | | |
| Turnout | 2,450 | 34% | +3% |
| | Labour hold | Swing | | |
Childwall
Childwall | Party | Candidate | Votes | % | ±% |
| | Conservative | William E. Dailey * | 4,890 | 71% | +6% |
| | Liberal | Owen Trevor Jones | 1,363 | 20% | -1% |
| | Labour | Stanley G. Thorne | 659 | 10% | -4% |
| Majority | 3,527 | | |
| Registered electors | 17,174 | | |
| Turnout | 6,912 | 40% | +5% |
| | Conservative hold | Swing | | |
Church
Church | Party | Candidate | Votes | % | ±% |
| | Conservative | Sir Charles C. Martin (PARTY) | 3,879 | 59% | +4% |
| | Liberal | John Swinnerton | 2,238 | 34% | -4% |
| | Labour | Vincent P. Hyams | 427 | 7% | 0% |
| Majority | 1,641 | | |
| Registered electors | 13,535 | | |
| Turnout | 6,544 | 48% | +2% |
| | Conservative hold | Swing | | |
Clubmoor
Clubmoor | Party | Candidate | Votes | % | ±% |
| | Conservative | John F. Jones | 2,797 | 57% | +15% |
| | Labour | Kenneth Stewart * | 2,099 | 43% | -9% |
| Majority | 698 | | |
| Registered electors | 10,442 | | |
| Turnout | 4,896 | 47% | +5% |
| | Conservative gain from Labour | Swing | | |
County
County | Party | Candidate | Votes | % | ±% |
| | Conservative | Percy Tunna | 3,073 | 59% | +10% |
| | Labour | George G. Maloney * | 1,875 | 36% | -15% |
| | Communist | Kenneth T. Dowd | 234 | 5% | +5% |
| Majority | 1,198 | | |
| Registered electors | 12,488 | | |
| Turnout | 5,182 | 41% | -1% |
| | Conservative gain from Labour | Swing | | |
Croxteth
Croxteth | Party | Candidate | Votes | % | ±% |
| | Conservative | Dr. George Harrald Prince (PARTY) | 4,326 | 83% | +27% |
| | Labour | Joseph H. Evans | 881 | 17% | -7% |
| Majority | 3,445 | | |
| Registered electors | 11,796 | | |
| Turnout | 5,207 | 44% | -2% |
| | Conservative hold | Swing | | |
Dingle
Dingle | Party | Candidate | Votes | % | ±% |
| | Labour | Roy Stoddart * | 1,818 | 48% | -16% |
| | Conservative | Mrs. Kathlenn Prescott | 1,784 | 47% | +11% |
| | Communist | David I. Thompson | 154 | 4% | |
| Majority | 34 | | |
| Registered electors | 10,633 | | |
| Turnout | 3,756 | 35% | +3% |
| | Labour hold | Swing | | |
Dovecot
Dovecot | Party | Candidate | Votes | % | ±% |
| | Conservative | Geoffrey E. Brandwood | 3,075 | 53% | +24% |
| | Labour | Thomas H. Maloney | 2,738 | 47% | -16% |
| Majority | 337 | | |
| Registered electors | 15,094 | | |
| Turnout | 5,813 | 39% | +9% |
| | Conservative gain from Labour | Swing | | |
Everton
Everton | Party | Candidate | Votes | % | ±% |
| | Labour | Francis Burke * | 862 | 46% | -27% |
| | Conservative | John Mass | 673 | 36% | +13% |
| | Liberal | Michael V. Lilley | 299 | 16% | +16% |
| Majority | 189 | | |
| Registered electors | 7,465 | | |
| Turnout | 1,887 | 25% | +5% |
| | Labour hold | Swing | | |
Fairfield
Fairfield | Party | Candidate | Votes | % | ±% |
| | Conservative | James S. Ross * | 2,484 | 68% | +20% |
| | Labour | John Guinan | 1,167 | 32% | -13% |
| Majority | 1,317 | | |
| Registered electors | 12,148 | | |
| Turnout | 1,317 | 30% | -3% |
| | Conservative hold | Swing | | |
Fazakerley
Fazakerley | Party | Candidate | Votes | % | ±% |
| | Conservative | Ingram A. T. Legge | 2,895 | 63% | +14% |
| | Labour | Dr. Norman S. Barnett | 1,729 | 37% | -14% |
| Majority | 1,166 | | |
| Registered electors | 11,156 | | |
| Turnout | 4,624 | 41% | -5% |
| | Conservative hold | Swing | | |
Gillmoss
Gillmoss | Party | Candidate | Votes | % | ±% |
| | Conservative | Peter J. Dunne | 2,089 | 45% | +21% |
| | Labour | Edward D. Roderick | 1,943 | 42% | -30% |
| | Liberal | Joseph R. Wilmington | 645 | 14% | +14% |
| Majority | 146 | | |
| Registered electors | 15,525 | | |
| Turnout | 4,677 | 30% | +1% |
| | Conservative gain from Labour | Swing | | |
Granby
Granby | Party | Candidate | Votes | % | ±% |
| | Conservative | Glyn Hughes | 1,259 | 48% | +13% |
| | Labour | James M. Burke * | 1,214 | 47% | -15% |
| Majority | 45 | | |
| Registered electors | 9,731 | | |
| Turnout | 2,596 | 27% | -4% |
| | Conservative gain from Labour | Swing | | |
Kensington
Kensington | Party | Candidate | Votes | % | ±% |
| | Conservative | Frederick R. Butler | 1,976 | 51% | +15% |
| | Labour | Mrs. Ethel M. Wormald | 1,884 | 49% | -15% |
| Majority | 92 | | |
| Registered electors | 11,056 | | |
| Turnout | 3,860 | 35% | +3% |
| | Conservative gain from Labour | Swing | | |
Low Hill
Low Hill | Party | Candidate | Votes | % | ±% |
| | Labour | Mrs. Mary J. Powell * | 1,364 | 56% | -17% |
| | Conservative | William F. Everett | 984 | 41% | +17% |
| | Communist | Donald P. Holland | 78 | 3% | 0% |
| Majority | 380 | | |
| Registered electors | 7,155 | | |
| Turnout | 2,426 | 34% | +6% |
| | Labour hold | Swing | | |
Melrose
Melrose 2 seats | Party | Candidate | Votes | % | ±% |
| | Labour | James J. Hastings * | 1,230 | 57% | -15% |
| | Labour | Benjamin Shaw | 1,173 | 54% | -18% |
| | Conservative | Thomas Head-Rapson | 945 | 43% | +15% |
| | Conservative | Daniel J. Jones | 941 | 43% | +15% |
| Majority | 285 | | |
| Registered electors | 8,212 | | |
| Turnout | 2,175 | 26% | -1% |
| | Labour hold | Swing | | |
| | Labour hold | Swing | | |
Netherfield
Old Swan
Old Swan | Party | Candidate | Votes | % | ±% |
| | Conservative | Arthur J. Browne | 2,987 | 60% | +18% |
| | Labour | Edward Loyden * | 1,968 | 40% | -10% |
| Majority | 1,019 | | |
| Registered electors | 13,412 | | |
| Turnout | 4,955 | 37% | +3% |
| | Conservative gain from Labour | Swing | | |
Picton
Picton | Party | Candidate | Votes | % | ±% |
| | Conservative | Clifford J. Kinrade | 2,694 | 59% | +21% |
| | Labour | Tom Bailey * | 1,899 | 41% | +14% |
| Majority | 795 | | |
| Registered electors | 12,839 | | |
| Turnout | 4,593 | 36% | +2% |
| | Conservative gain from Labour | Swing | | |
Pirrie
Pirrie | Party | Candidate | Votes | % | ±% |
| | Conservative | Peter J. McCann | 3,485 | 53% | +20% |
| | Labour | John Dalrymple (PARTY) | 3,040 | 47% | -20% |
| Majority | 445 | | |
| Registered electors | 15,645 | | |
| Turnout | 6,525 | 42% | +5% |
| | Conservative gain from Labour | Swing | | |
Prince's Park
Prince's Park | Party | Candidate | Votes | % | ±% |
| | Conservative | William T. Savage | 2,016 | 51% | +16% |
| | Labour | Thomas C. Greenwood | 1,819 | 46% | -12% |
| | Communist | John Galloway | 152 | 4% | +4% |
| Majority | 197 | | |
| Registered electors | 11,440 | | |
| Turnout | 3,987 | 35% | +8% |
| | Conservative gain from Labour | Swing | | |
Sandhills
Sandhills | Party | Candidate | Votes | % | ±% |
| | Labour | Miss Margaret Schofield (PARTY) | 1,394 | 69% | -17% |
| | Conservative | Frederick Jones | 544 | 27% | +16% |
| | Communist | Brian Campbell | 72 | 4% | 0% |
| Majority | 850 | | |
| Registered electors | 7,025 | | |
| Turnout | 2,010 | 29% | -2% |
| | Labour hold | Swing | | |
St. Domingo
St. James
St. James | Party | Candidate | Votes | % | ±% |
| | Labour | Robert Parry * | 1,015 | 51% | -23% |
| | Conservative | Mrs. Jessie E. Reid | 522 | 26% | +6% |
| | Liberal | Gershon Greenberg | 248 | 12% | +12% |
| | Communist | Roger O'Hara | 215 | 11% | +5% |
| Majority | 493 | | |
| Registered electors | 8,612 | | |
| Turnout | 2,000 | 23% | -3% |
| | Labour hold | Swing | | |
St. Mary's
St. Mary's | Party | Candidate | Votes | % | ±% |
| | Conservative | William L. Harris | 2,194 | 52% | +18% |
| | Labour | Stanley R. Maddox * | 2,021 | 48% | -18% |
| Majority | 173 | | |
| Registered electors | 9,925 | | |
| Turnout | 4,215 | 42% | +5% |
| | Conservative gain from Labour | Swing | | |
St. Michael's
St. Michael's | Party | Candidate | Votes | % | ±% |
| | Conservative | Mrs. Marion Browne M.B.E. * | 2,653 | 68% | +19% |
| | Labour | David M. Mitchell | 852 | 22% | -1% |
| | Liberal | Miss Margaret J. Baber | 411 | 10% | -18% |
| Majority | 1,801 | | |
| Registered electors | 9,648 | | |
| Turnout | 3,916 | 41% | -5% |
| | Conservative hold | Swing | | |
Smithdown
Smithdown | Party | Candidate | Votes | % | ±% |
| | Labour | George W. Clarke * | 1,034 | 53% | -15% |
| | Conservative | Stanley Whittaker | 930 | 47% | +21% |
| Majority | 104 | | |
| Registered electors | 10,160 | | |
| Turnout | 1,964 | 19% | -5% |
| | Labour hold | Swing | | |
Speke
Speke | Party | Candidate | Votes | % | ±% |
| | Conservative | Harry K. Jones | 1,913 | 53% | +32% |
| | Labour | Stephen J. Cook | 1,709 | 47% | -25% |
| Majority | 204 | | |
| Registered electors | 13,899 | | |
| Turnout | 3,622 | 26% | +2% |
| | Conservative gain from Labour | Swing | | |
Tuebrook
Tuebrook | Party | Candidate | Votes | % | ±% |
| | Conservative | Norman A. Pannell | 2,932 | 61% | |
| | Labour | James Mottram | 1,901 | 39% | -13% |
| Majority | 1,031 | | |
| Registered electors | 11,413 | | |
| Turnout | 4,833 | 42% | +4% |
| | Conservative gain from Labour | Swing | | |
Vauxhall
Vauxhall | Party | Candidate | Votes | % | ±% |
| | Labour | Paul Orr * | 1,073 | 84% | -10% |
| | Conservative | Herbert A. Williams | 150 | 12% | +8% |
| | Communist | Thomas E. Cassin | 59 | 5% | +3% |
| Majority | 923 | | |
| Registered electors | 7,610 | | |
| Turnout | 1,282 | 17% | -11% |
| | Labour hold | Swing | | |
Warbreck
Warbreck | Party | Candidate | Votes | % | ±% |
| | Conservative | Albert H. K. Maynard * | 2,859 | 70% | +13% |
| | Labour | Peter Comer | 2,232 | 30% | -13% |
| Majority | 1,627 | | |
| Registered electors | 11,868 | | |
| Turnout | 4,091 | 34% | -2% |
| | Conservative hold | Swing | | |
Westminster
Westminster | Party | Candidate | Votes | % | ±% |
| | Conservative | James Gillin | 1,210 | 51% | +15% |
| | Labour | Edward Burke * | 1,165 | 49% | -15% |
| Majority | 45 | | |
| Registered electors | 6,047 | | |
| Turnout | 2,375 | 39% | +5% |
| | Conservative gain from Labour | Swing | | |
Woolton
Woolton | Party | Candidate | Votes | % | ±% |
| | Conservative | Joseph Norton * | 5,606 | 79% | +17% |
| | Labour | George J. Maudsley | 1,468 | 21% | -7% |
| Majority | 4,138 | | |
| Registered electors | 19,254 | | |
| Turnout | 7,074 | 37% | +1% |
| | Conservative hold | Swing | | |
[2] [3]
Aldermanic Elections
Twenty of the forty Aldermen were elected by the city council on 22 May 1967. Those elected by the council and the wards they were allocated to are shown in the table below:
| Party | Alderman | Ward |
| | Conservative | Stanley Airey | St. James |
| | Conservative | Herbert M. Allen | Speke |
| | Conservative | Alfred N. Bates | Dovecot |
| | Conservative | William Browne | Clubmoor |
| | Conservative | Arthur B. Collins M.B.E. | Abercromby |
| | Conservative | Charles Cowlin | old Swan |
| | Conservative | Raymond F. Craine M.B.E. | Vauxhall |
| | Conservative | Harold W. Hughes O.B.E. | Tuebrook |
| | Conservative | John Keenan | Woolton |
| | Conservative | Harold Lees | Westminster |
| | Conservative | Arthur W. Lowe O.B.E. | Melrose |
| | Conservative | Robert Meadows | Princes Park |
| | Conservative | Stephen Minion O.B.E. | Anfield |
| | Conservative | Joseph Norton | Broadgreen |
| | Conservative | Ralph Rattray | Pirrie |
| | Conservative | Leslie H. Sanders | Aigburth |
| | Conservative | Harold M. Steward | Low Hill |
| | Conservative | James E. Thompson | St. Domingo |
| | Conservative | Frank Woolfenden | Fazakerley |
| | Conservative | Alexander Young | St. Michael's |
[4]
References


 Local elections in Merseyside


